Feature Overview
Smart Invest Assistant is an investment assistance tool designed for individual investors, featuring "Investment Strategy Mind Mapping", "Opportunity and Risk Alerts", "Macro Data", "Index Investment Analysis", "Market Sentiment", "Key News", "My Holdings", "Research Notes", "Family Finances", and more.
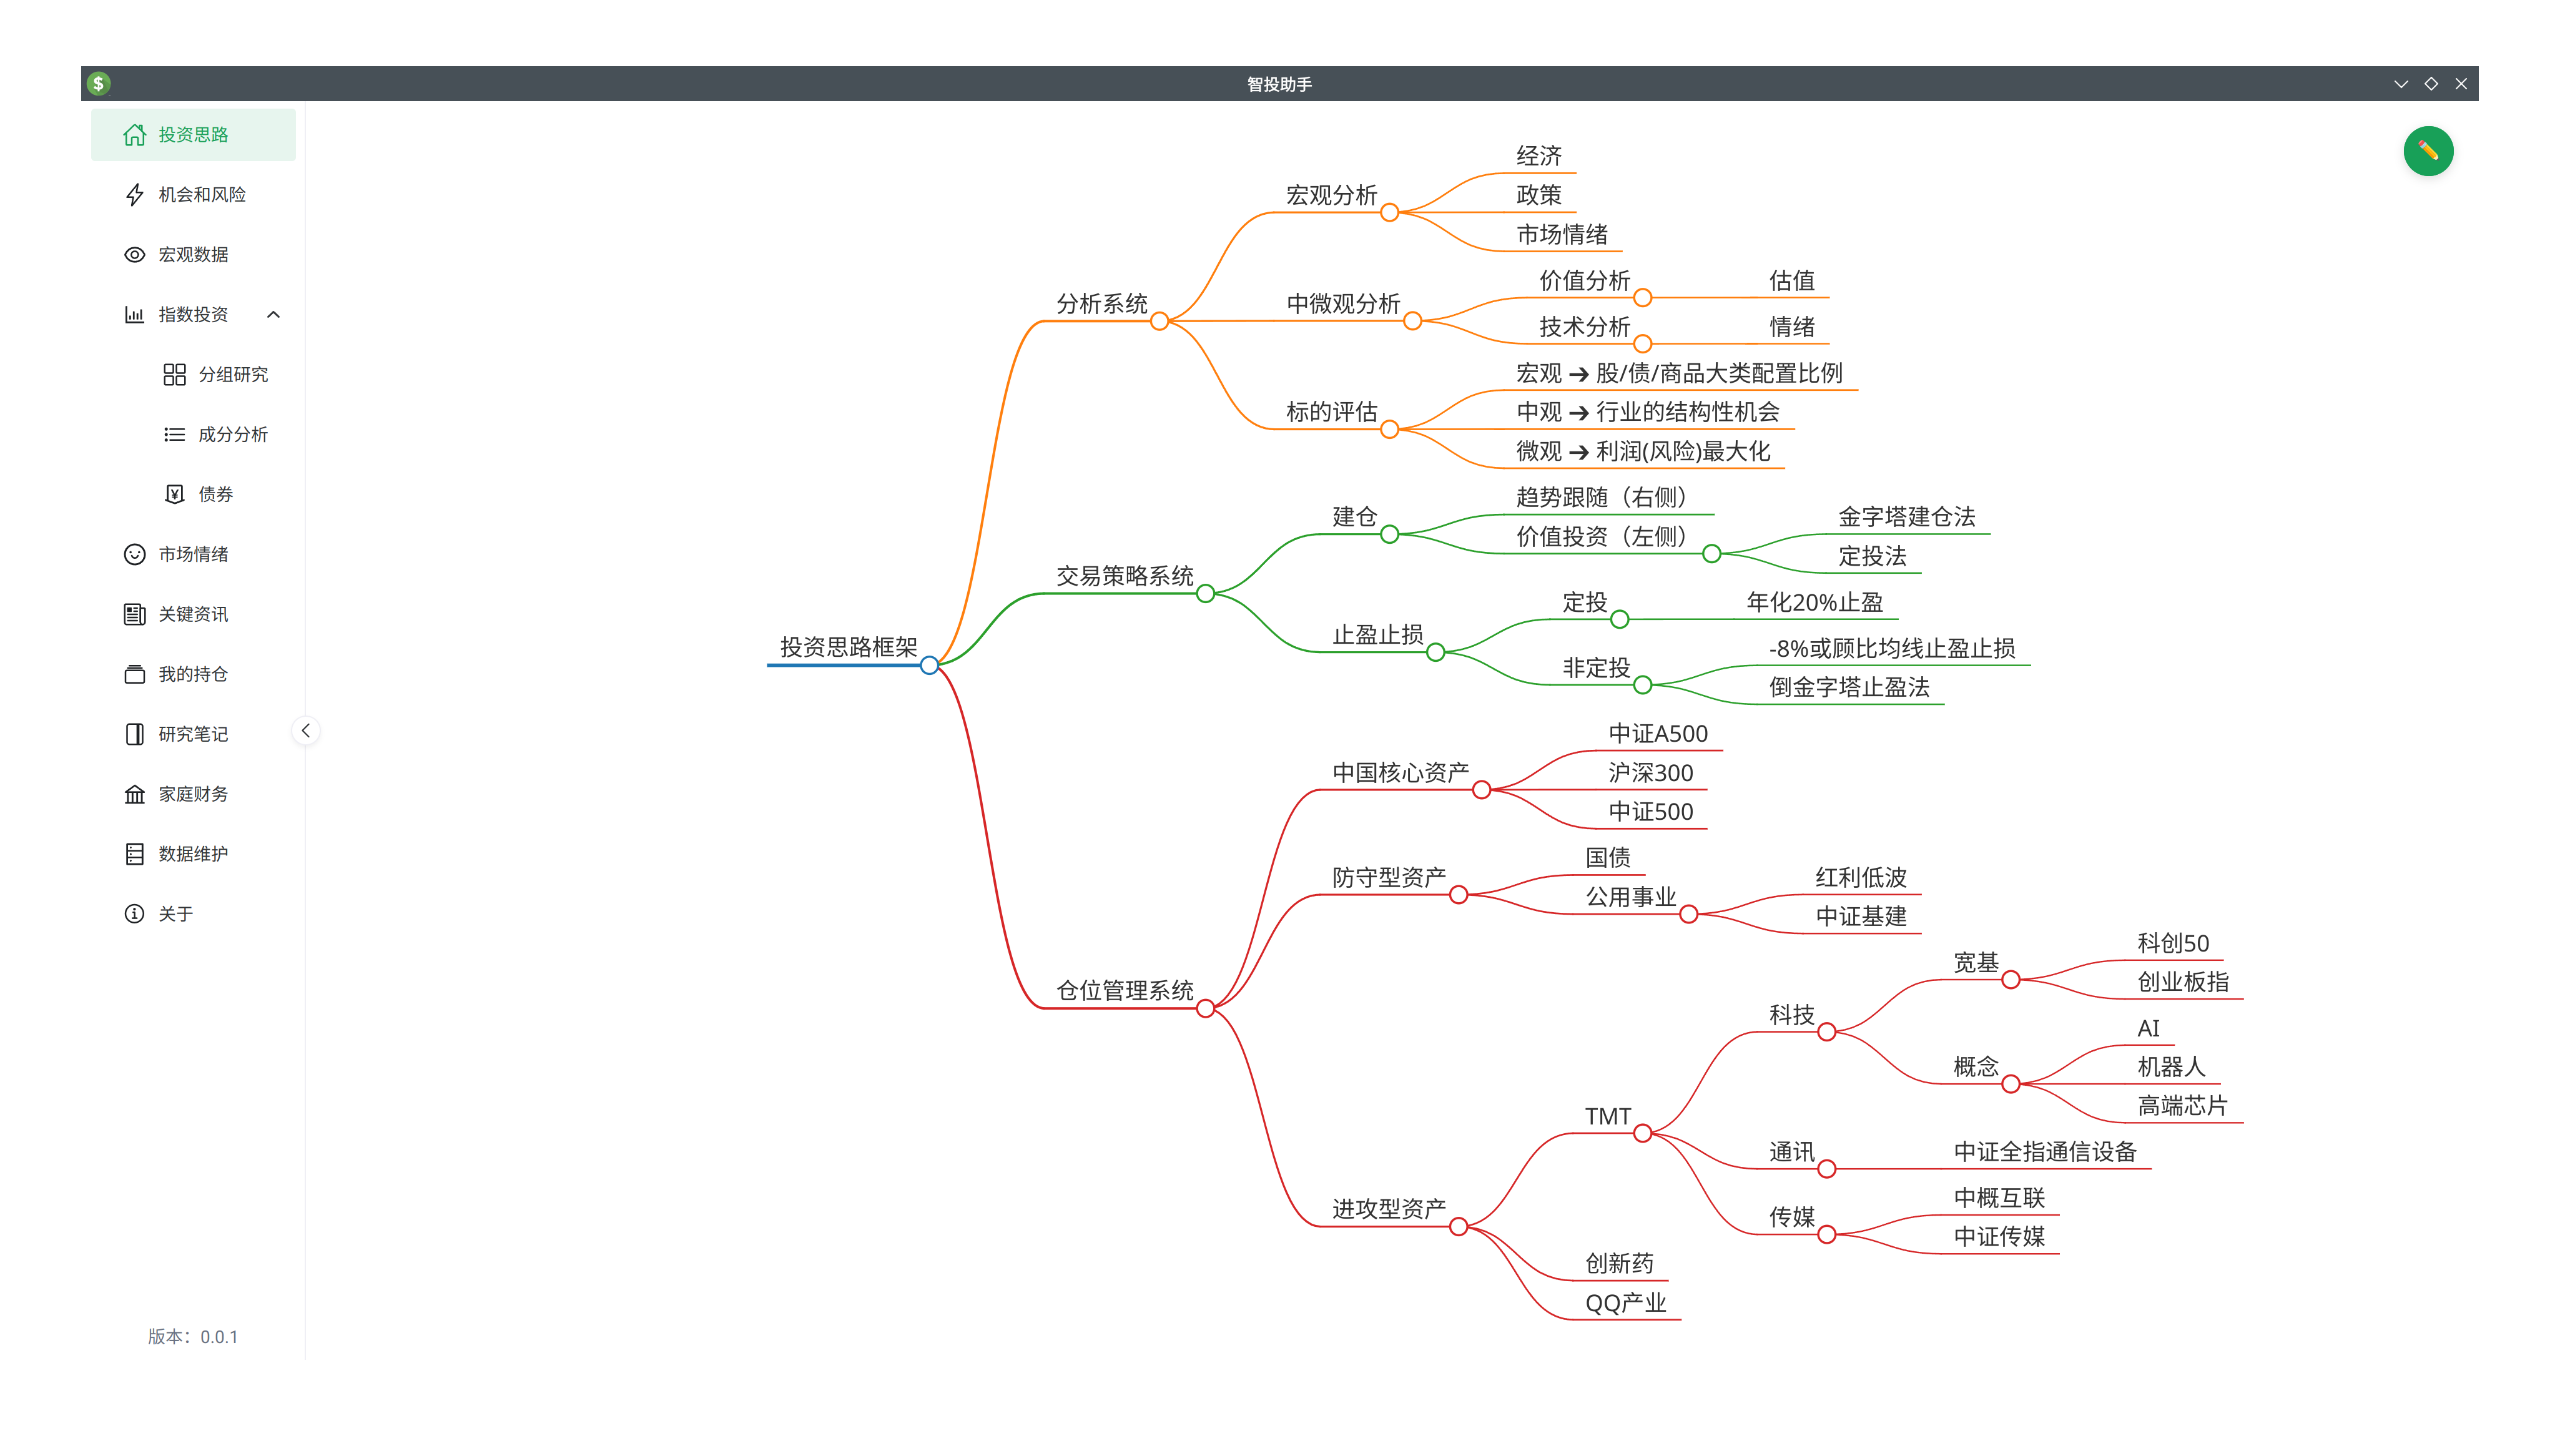
Investment Strategy
The goal of this module is to allow investors to regularly review their investment ideas. Click the "Edit" button in the top right corner to create your own mind map using Markdown syntax. If you are not familiar with Markdown, here is a 5-minute Markdown Quick Start.
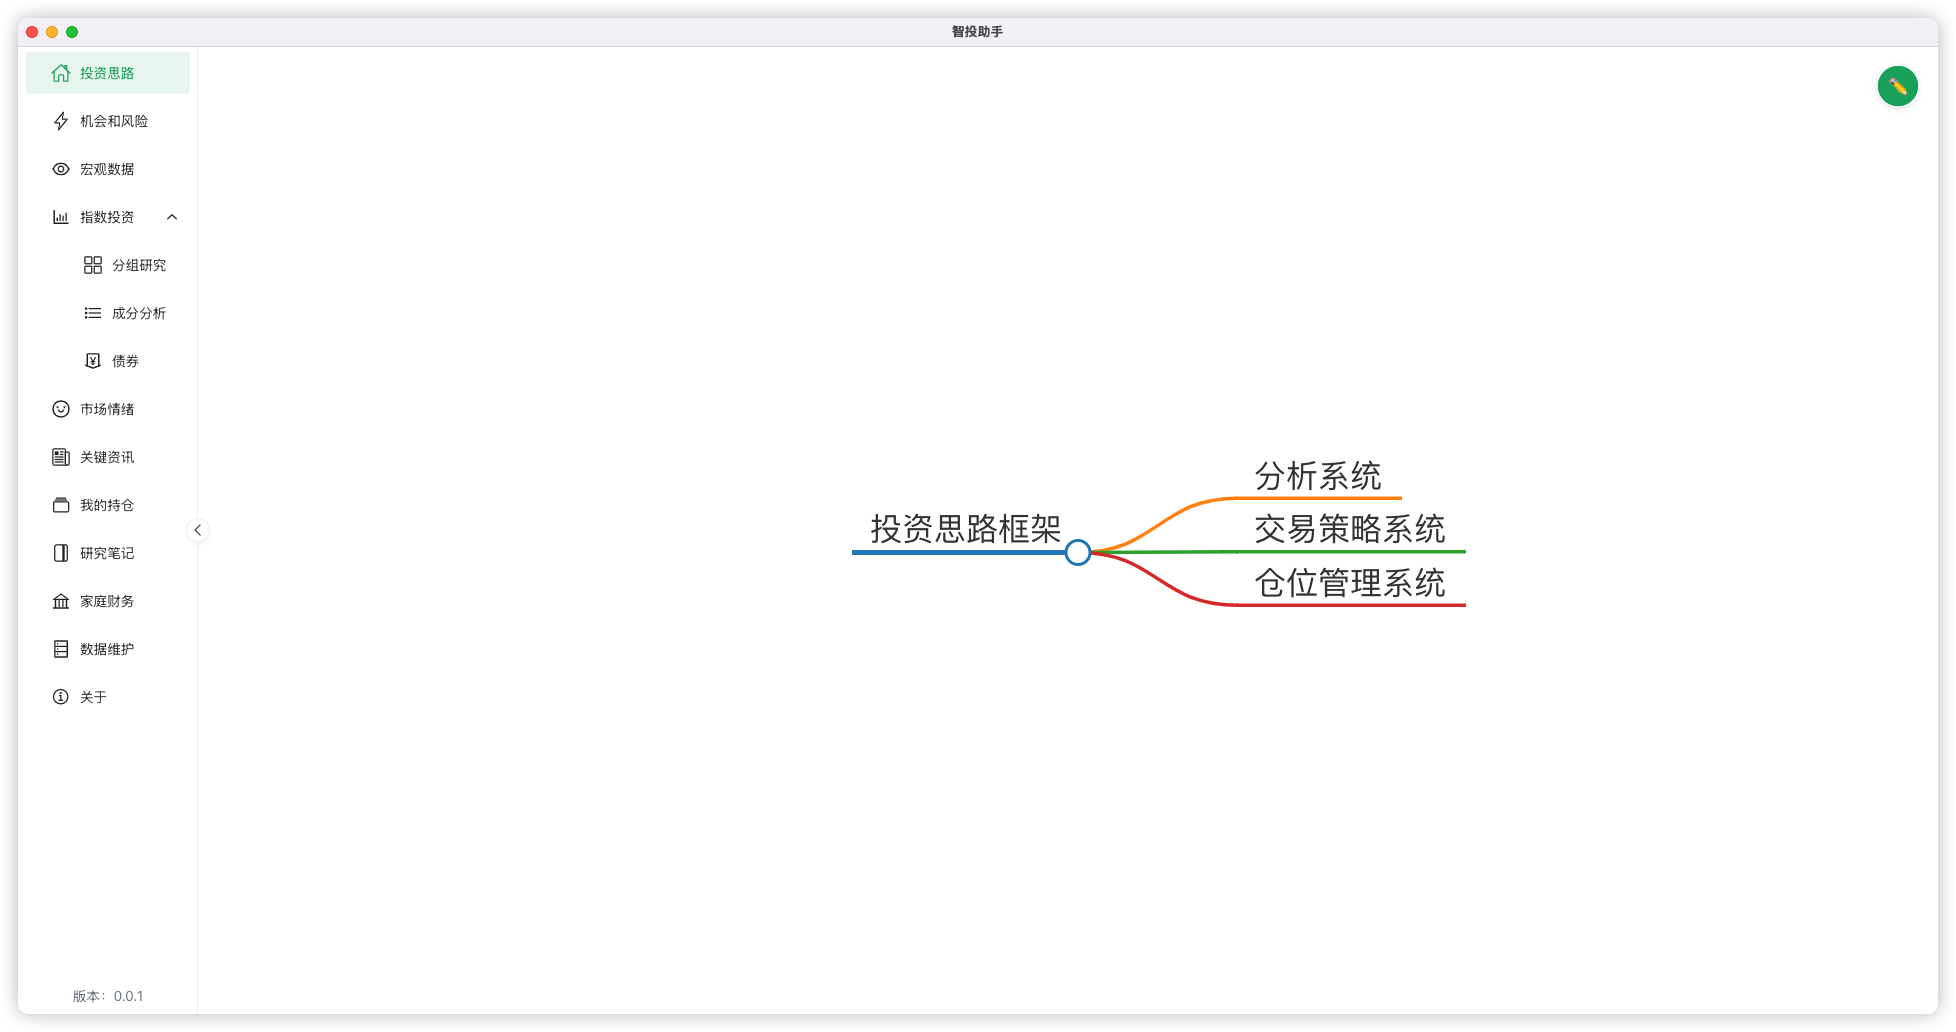
Everyone should have their own investment logic, and as your knowledge expands and experience updates, your investment logic should also evolve. Every time you open the software, you can review your investment logic to avoid being influenced by short-term popular news. Below is a reference.
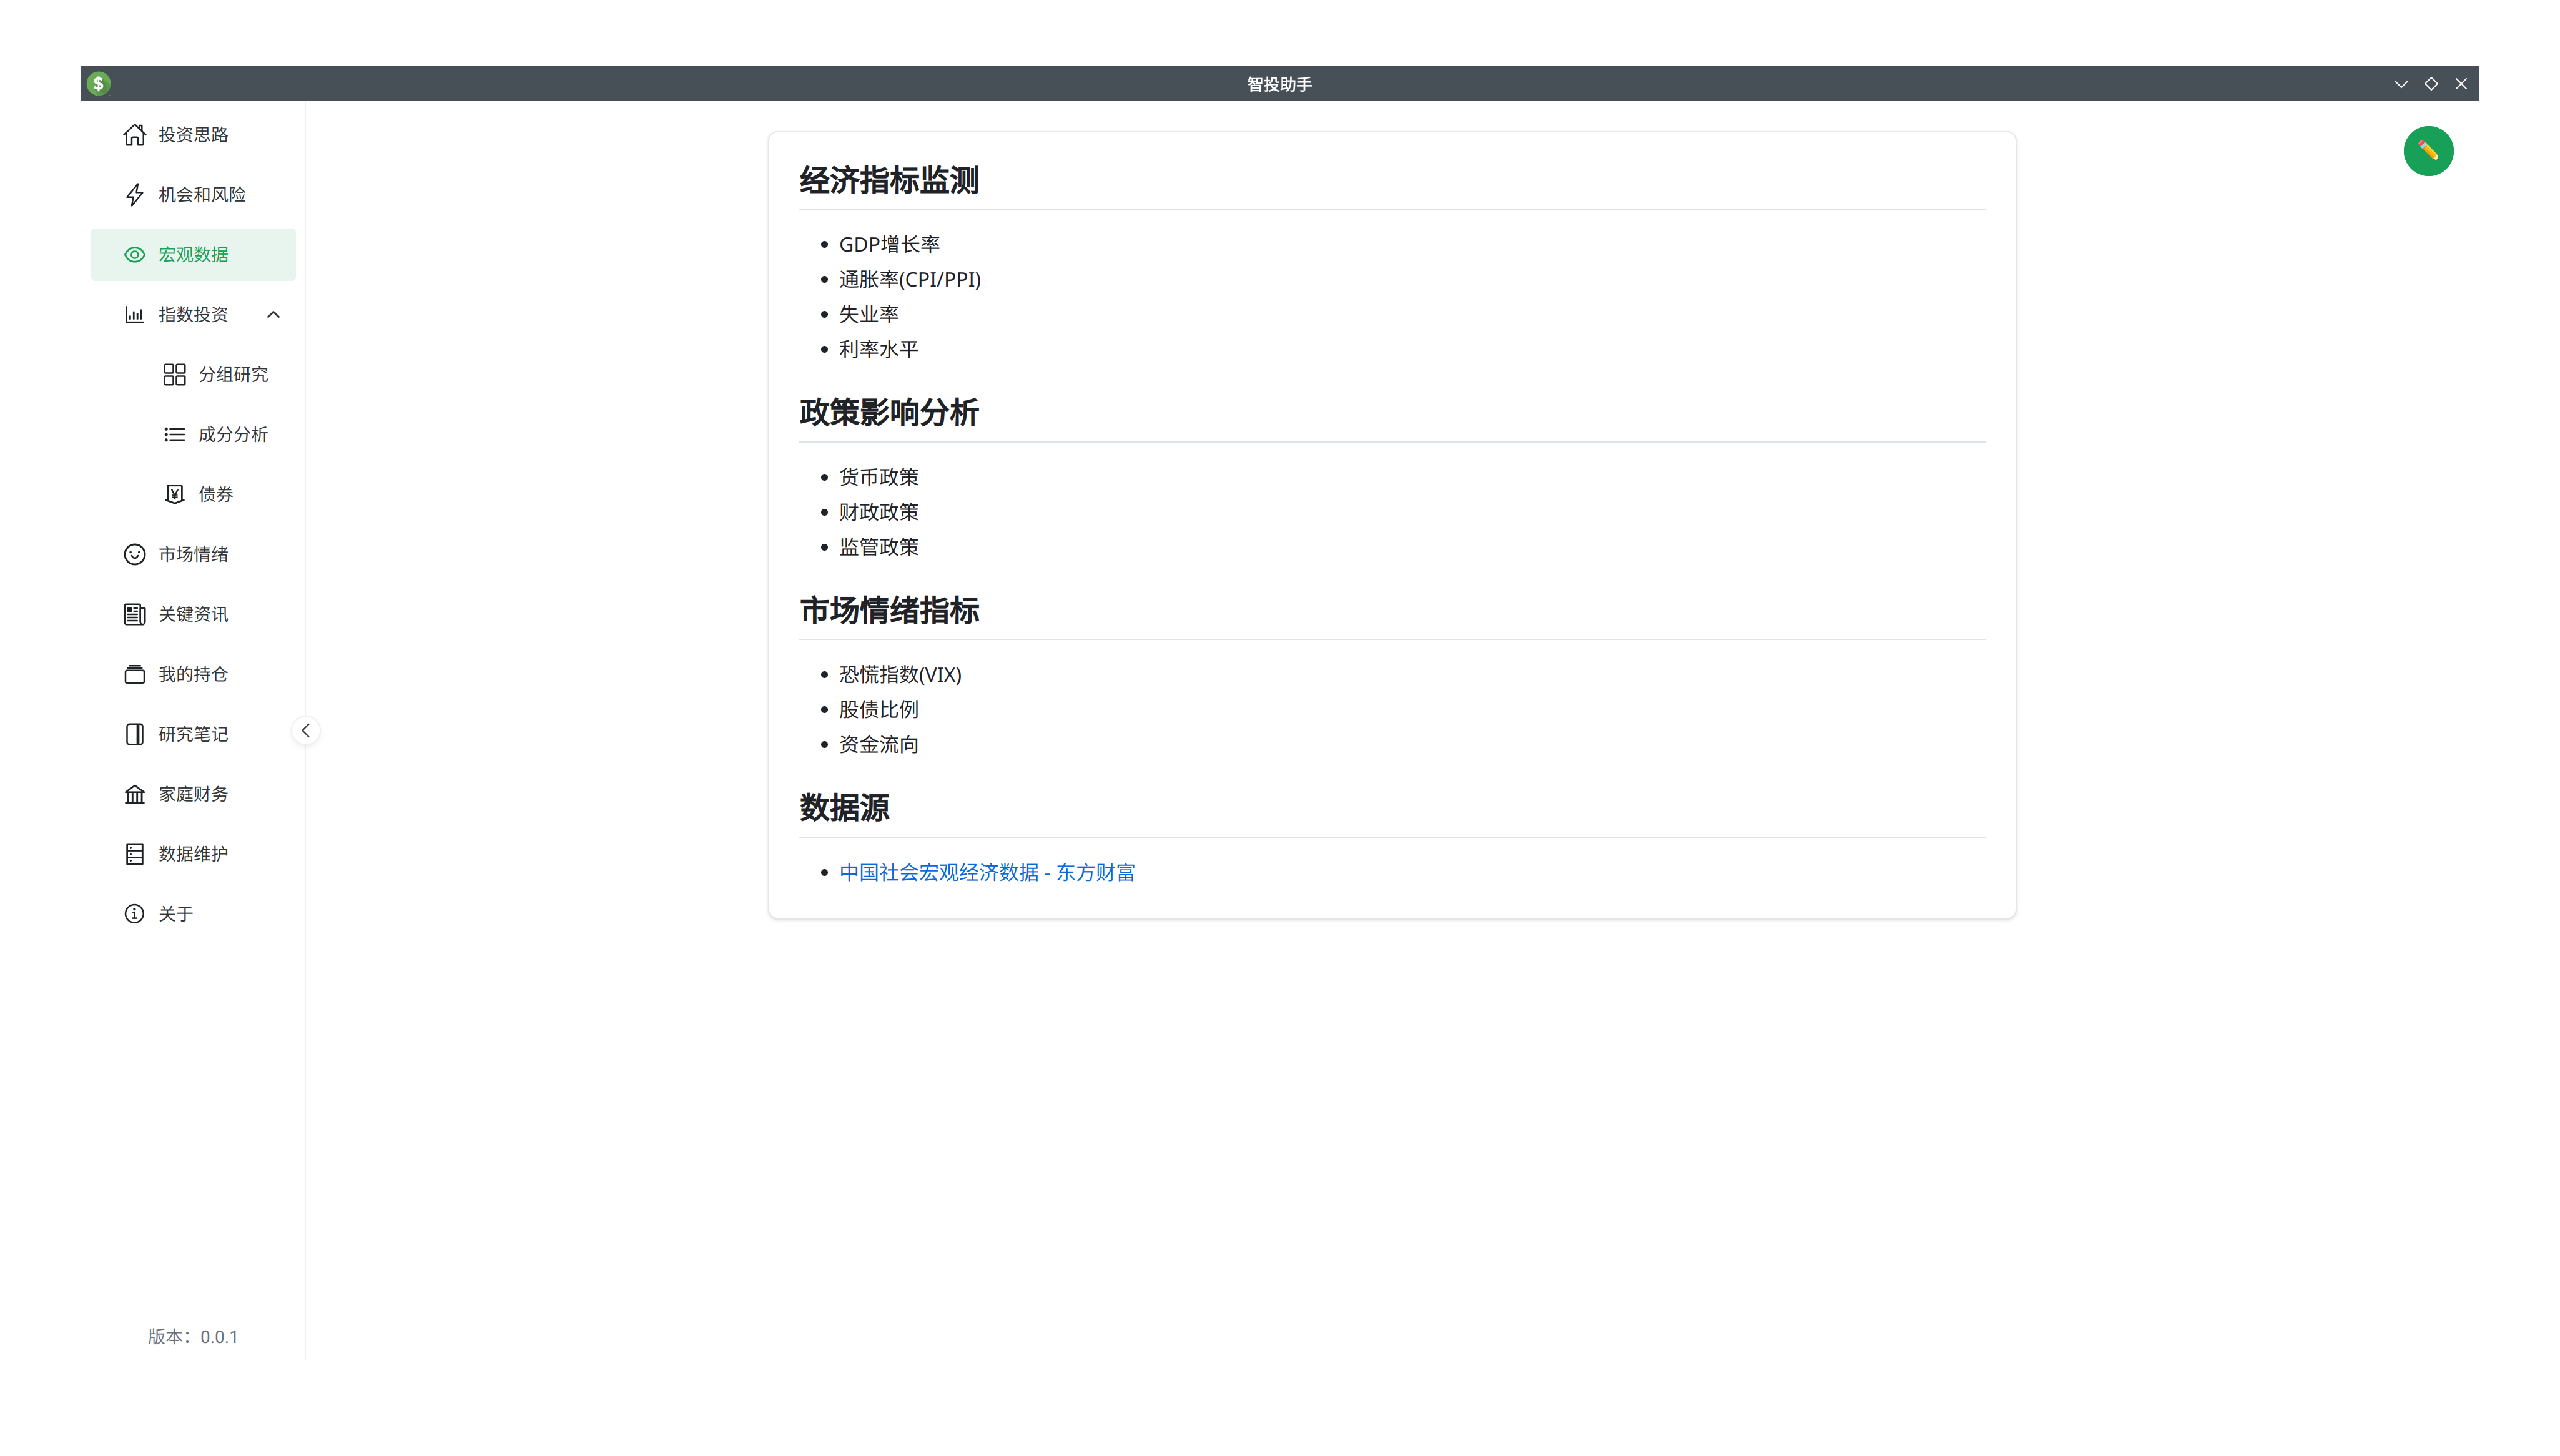
Macro Data
Currently, this module does not have a data crawling function, primarily because these are low-frequency data points that only need to be checked once a month. Additionally, websites like East Money already provide excellent data displays. Therefore, this module currently contains a freely editable Markdown document where you can paste links to third-party data. We can add more features later if third-party sites no longer meet our needs.
Index Investment
Depending on our research capabilities, we can invest in different types of securities.
- If you have no interest in analyzing listed companies or industries but are optimistic about national development, the simplest way is to invest in broad market indices (e.g., CSI 300, CSI A500).
- If you have strong research interests and capabilities, you can move down one level to "Industry Research". When the stock market only has structural opportunities (only some industries rise while others don't), investing in industries can yield better returns than broad indices.
- If your interest and research capabilities are even stronger and you have a deep understanding of listed companies, picking the right stocks can yield even better returns. Conversely, this requires the most from investors and carries the highest risk.
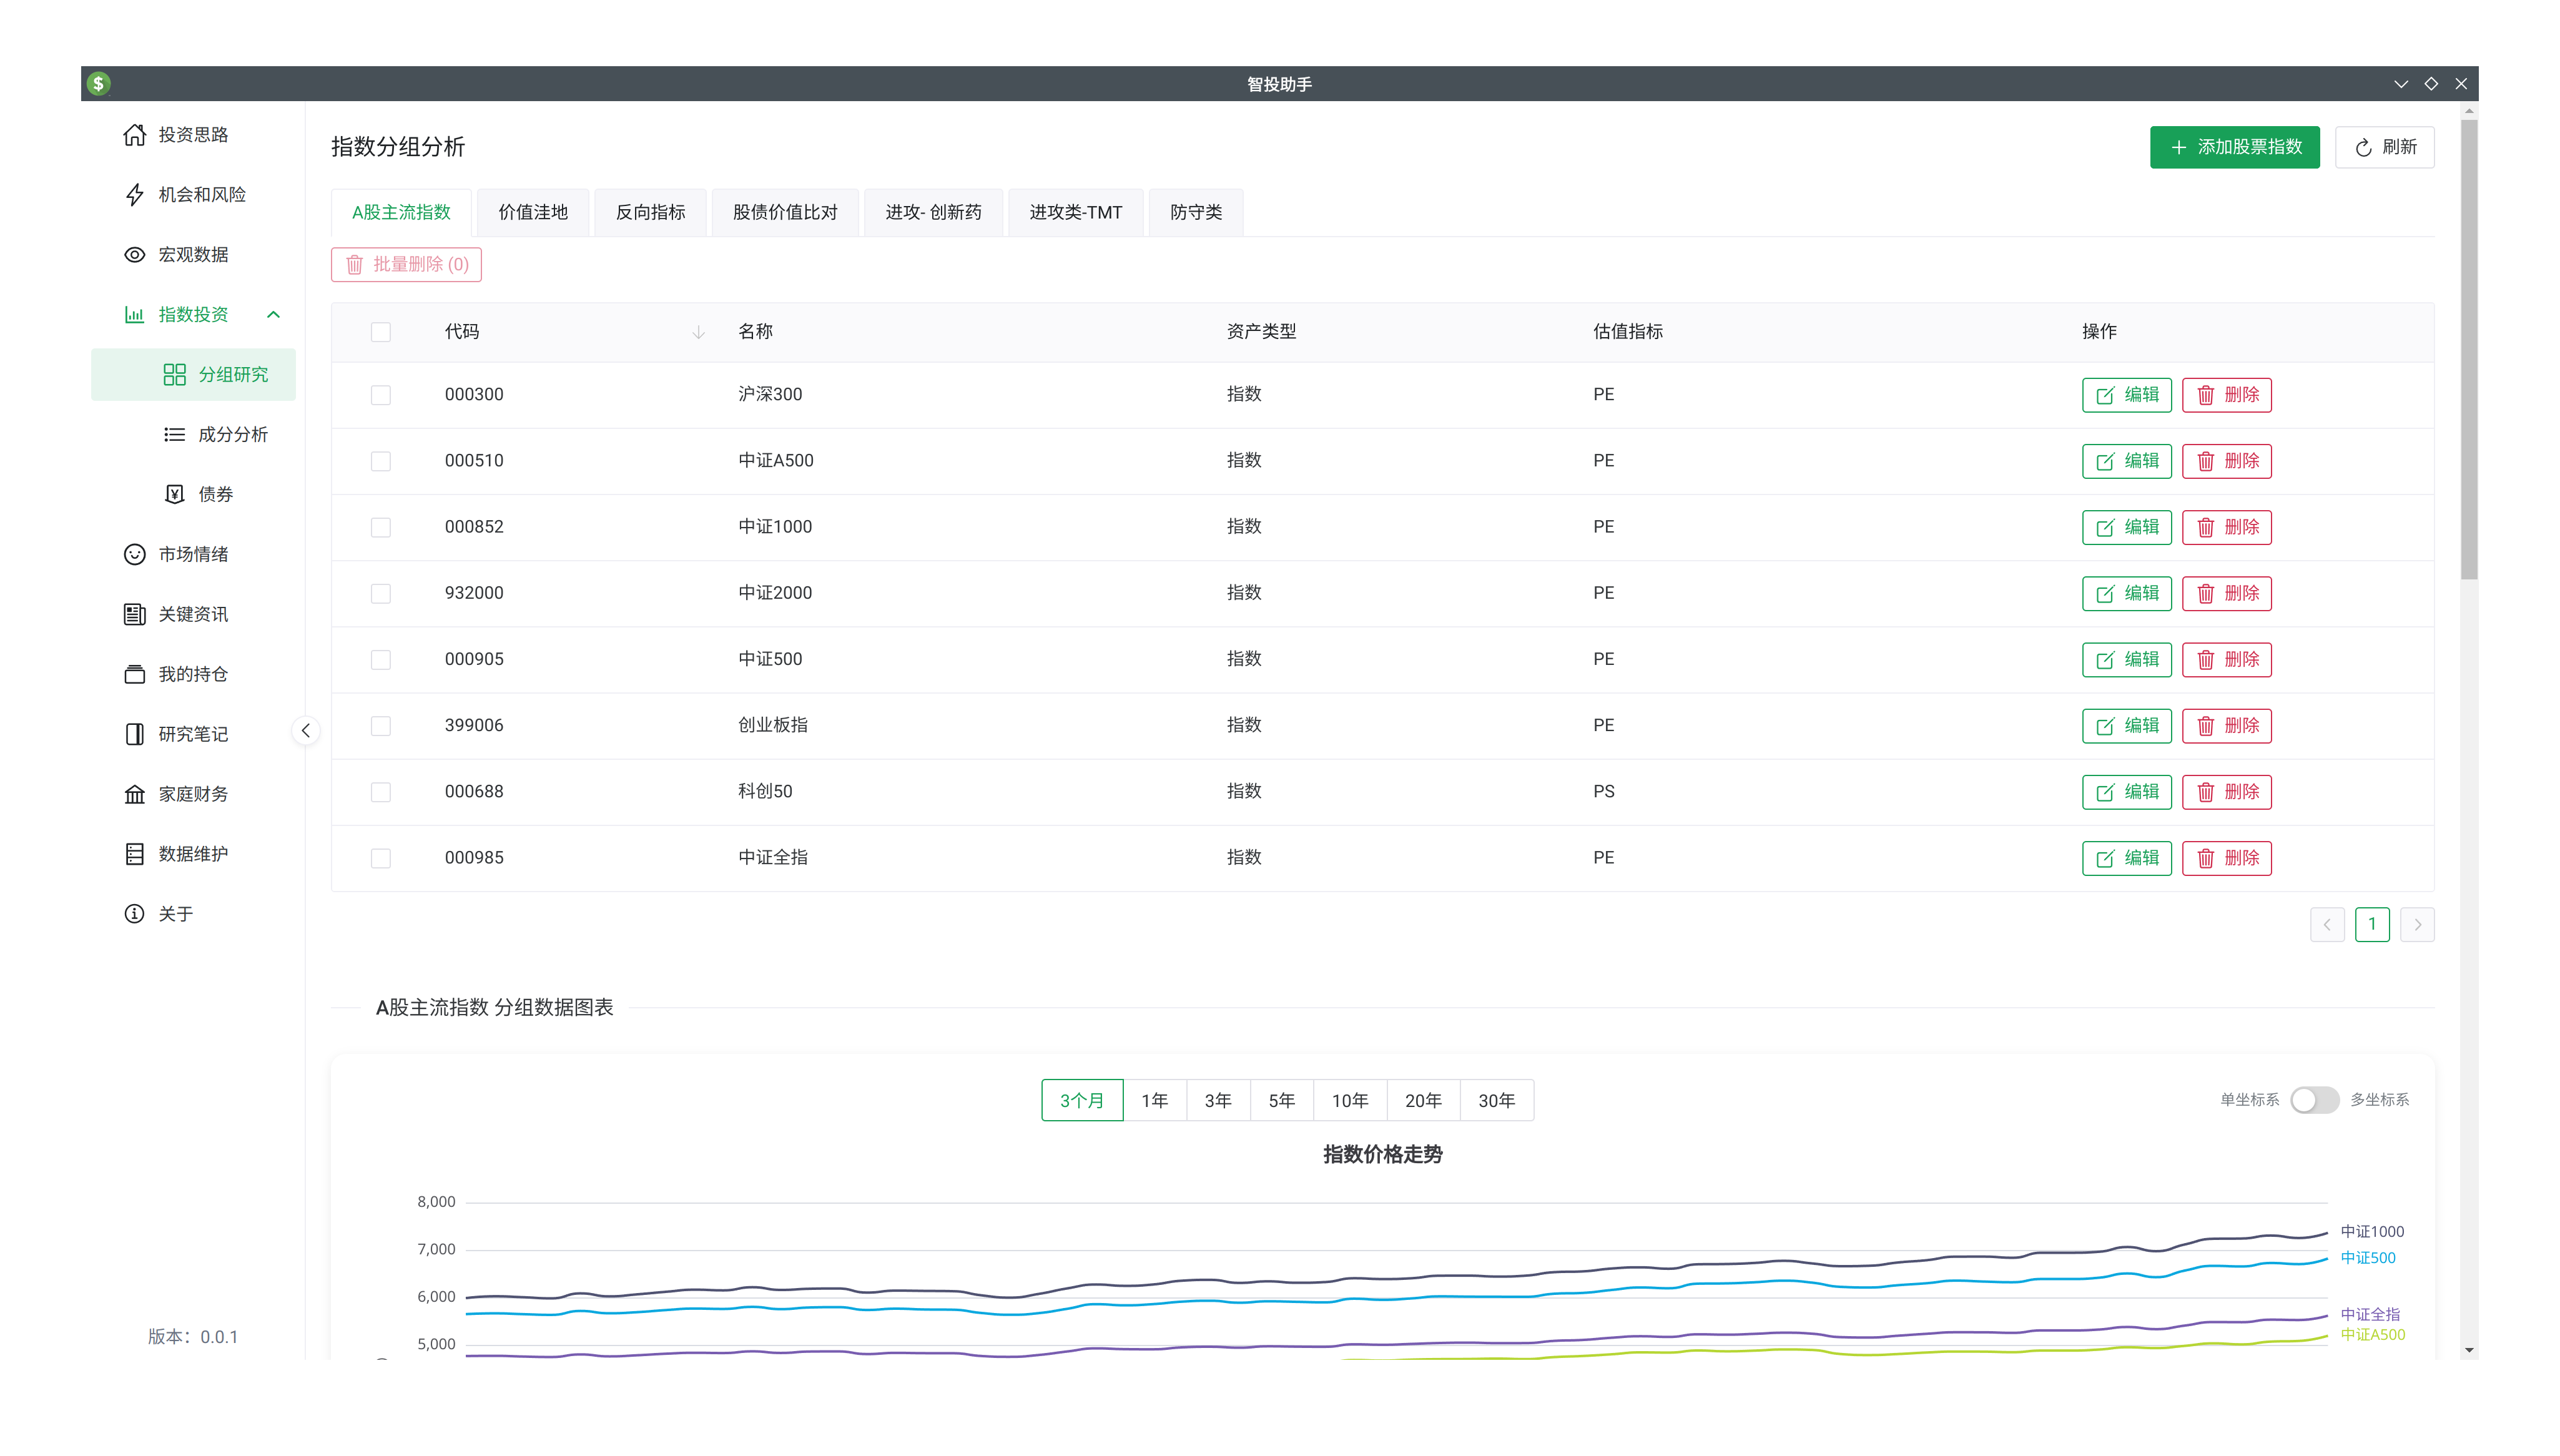
The "Index Investment" module of this software is designed based on the concept of "Industry Investment". In this module, you can create multiple groups and perform side-by-side comparisons of indices within those groups. Currently, the most focused indicators are "Level/Price", "Volume", and "Valuation".
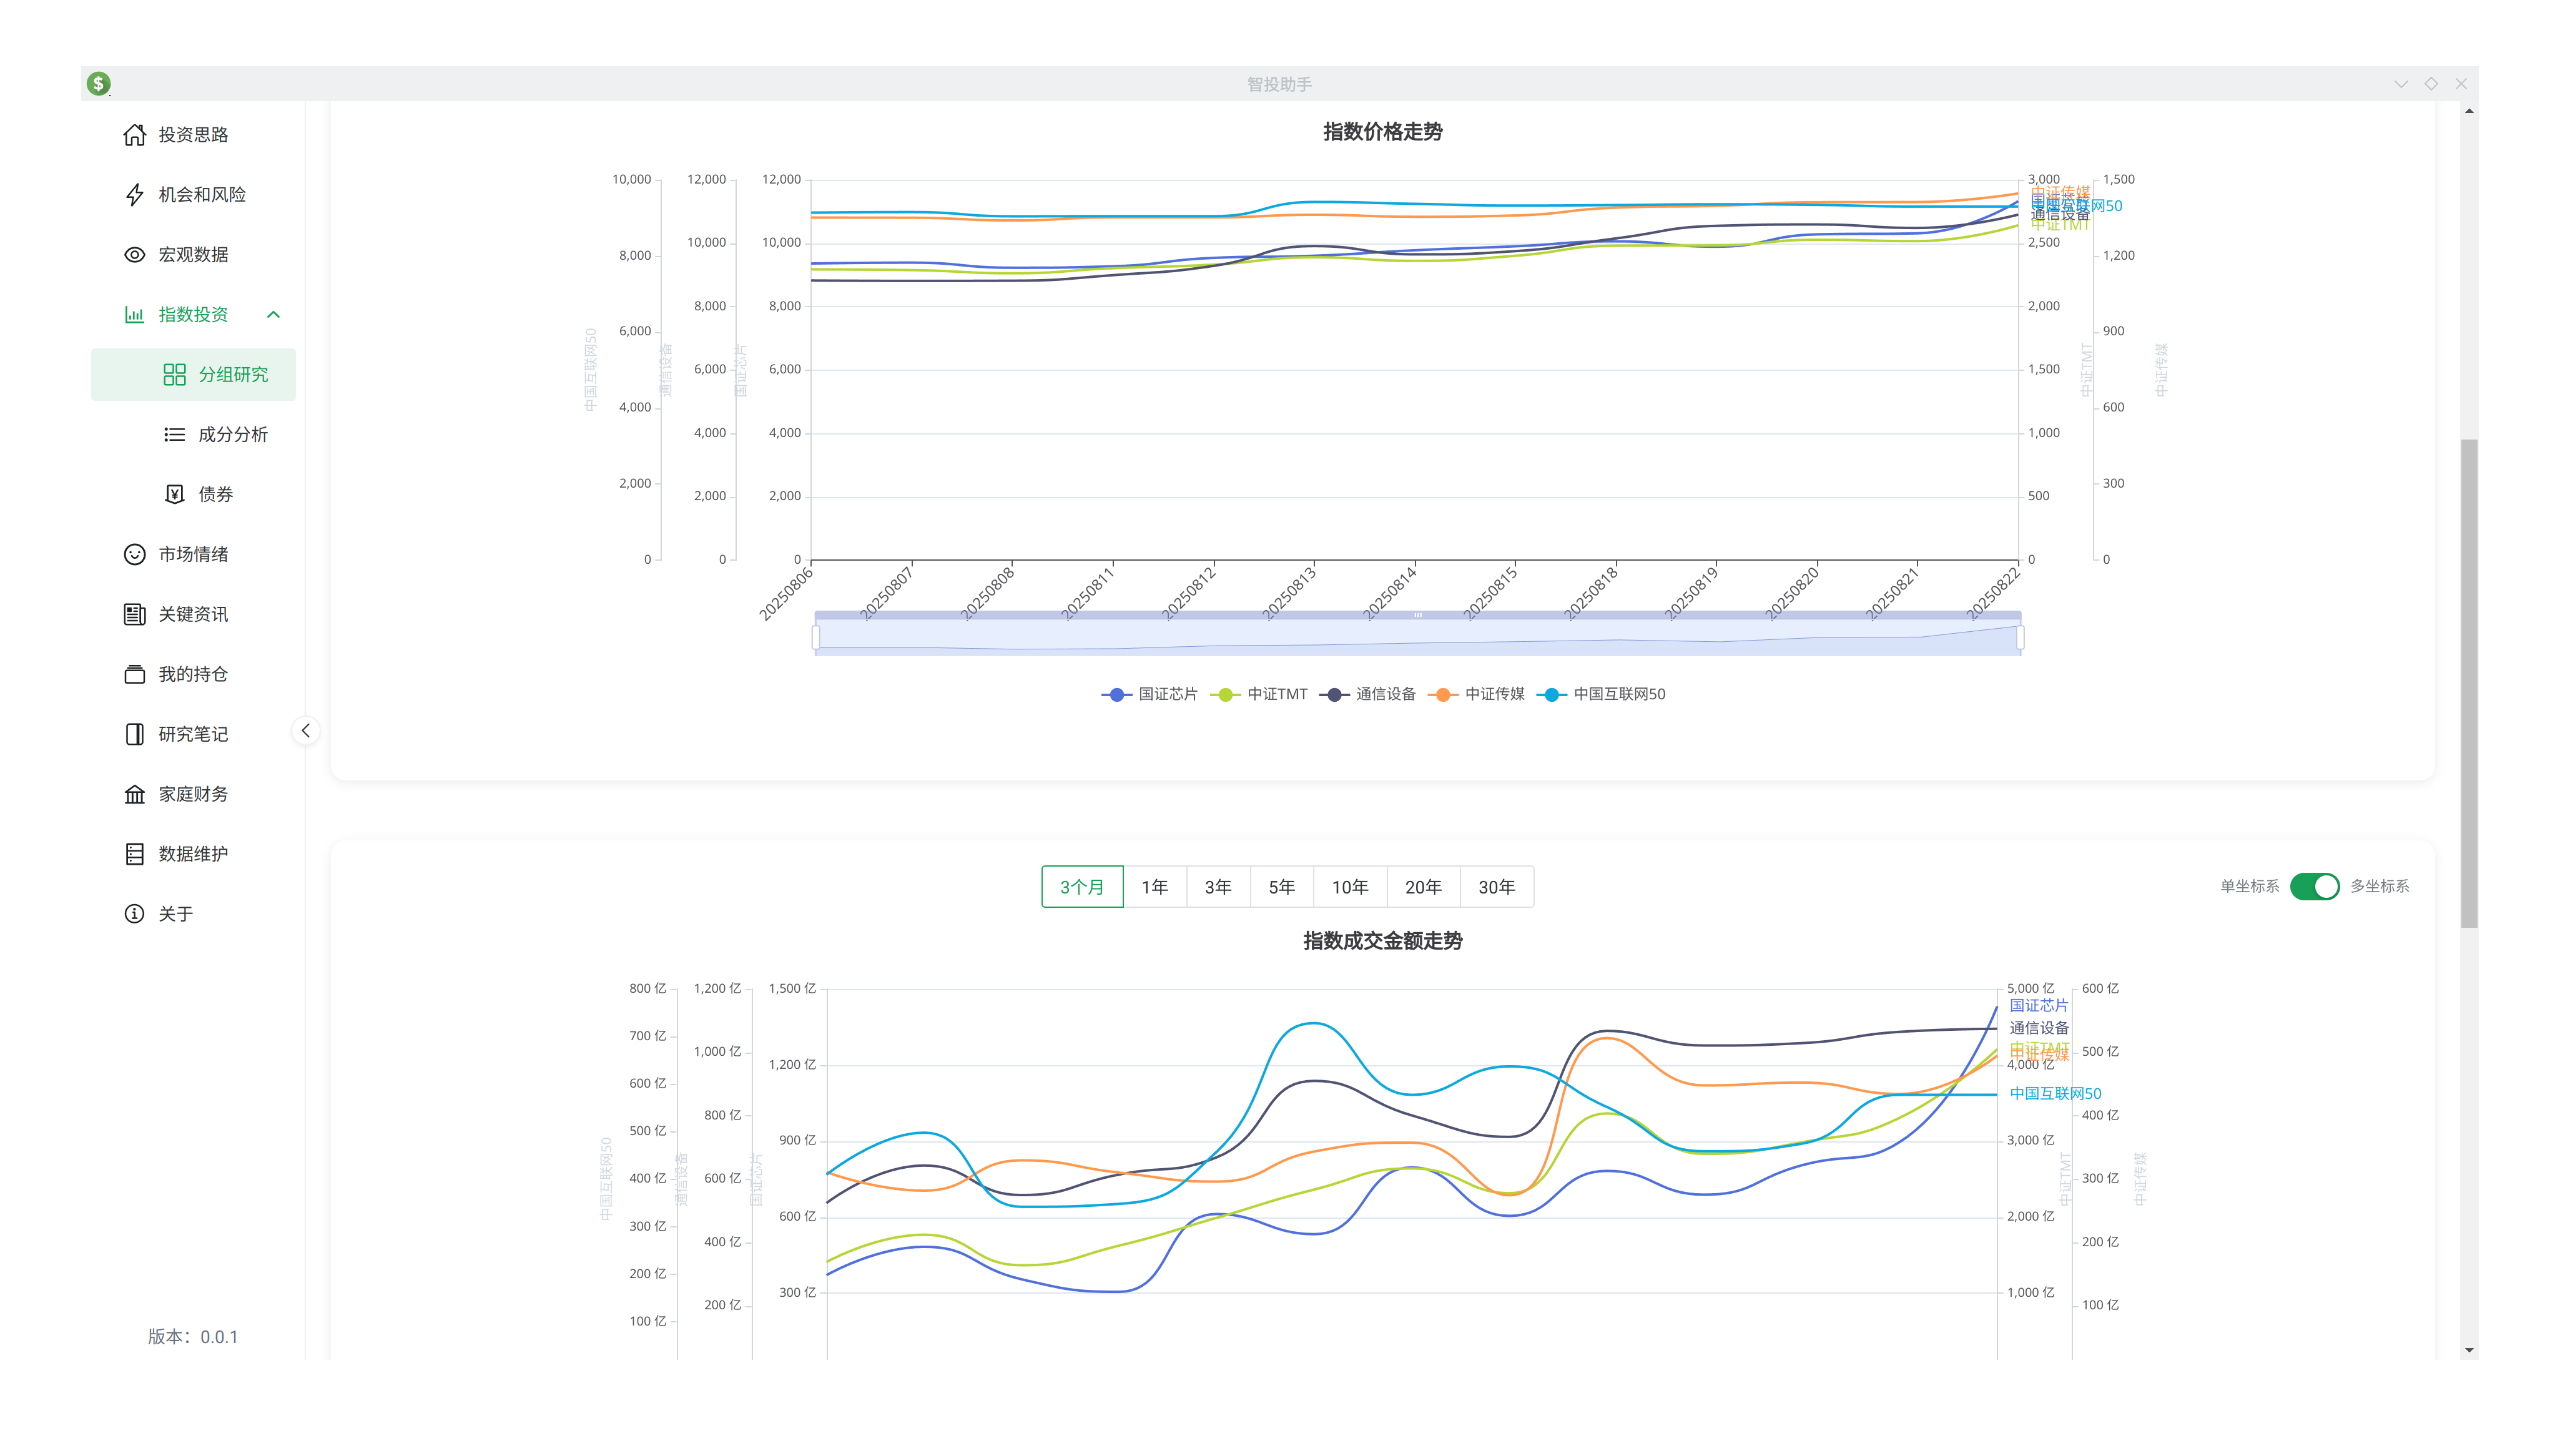
- Viewing the levels of multiple indices in the same chart allows you to compare their trend speed over the same period (e.g., which index is rising/falling faster).
- Comparing the trading volume of multiple indices helps gauge their popularity over the same period, which reflects market sentiment. While indicators like MACD, KDJ, and BOLL also reflect overbought/oversold conditions, I believe they often become distorted due to averaging and smoothing and only focus on price without accounting for volume. Volume is the most authentic reflection of market sentiment—it's hundreds of millions of people voting with real money, expressing their agreement on value and their inner excitement or fear.
- Valuation is the standard for assessing whether a stock/index is expensive. Determining if a single stock is expensive is extremely difficult. There are many valuation theories, and different theories lead to different calculation methods and indicators. Broadly speaking, one is the Discounted Cash Flow (DCF) method used by Warren Buffett. Another is the relative comparison method, comparing the current state with historical data (e.g., PE percentile, PB percentile, PS percentile) or with other companies in the same industry. Comparing valuation indicators of companies in the same industry or similar indices is very intuitive. This feature is currently under development and will be released soon.
In some cases, when we invest in both industry indices and leading individual stocks, or in both broad industry and sub-industry indices (like TMT, which covers technology, communication, and media), you may find that their price trends and valuations are not identical. You can rotate between them to improve excess returns.
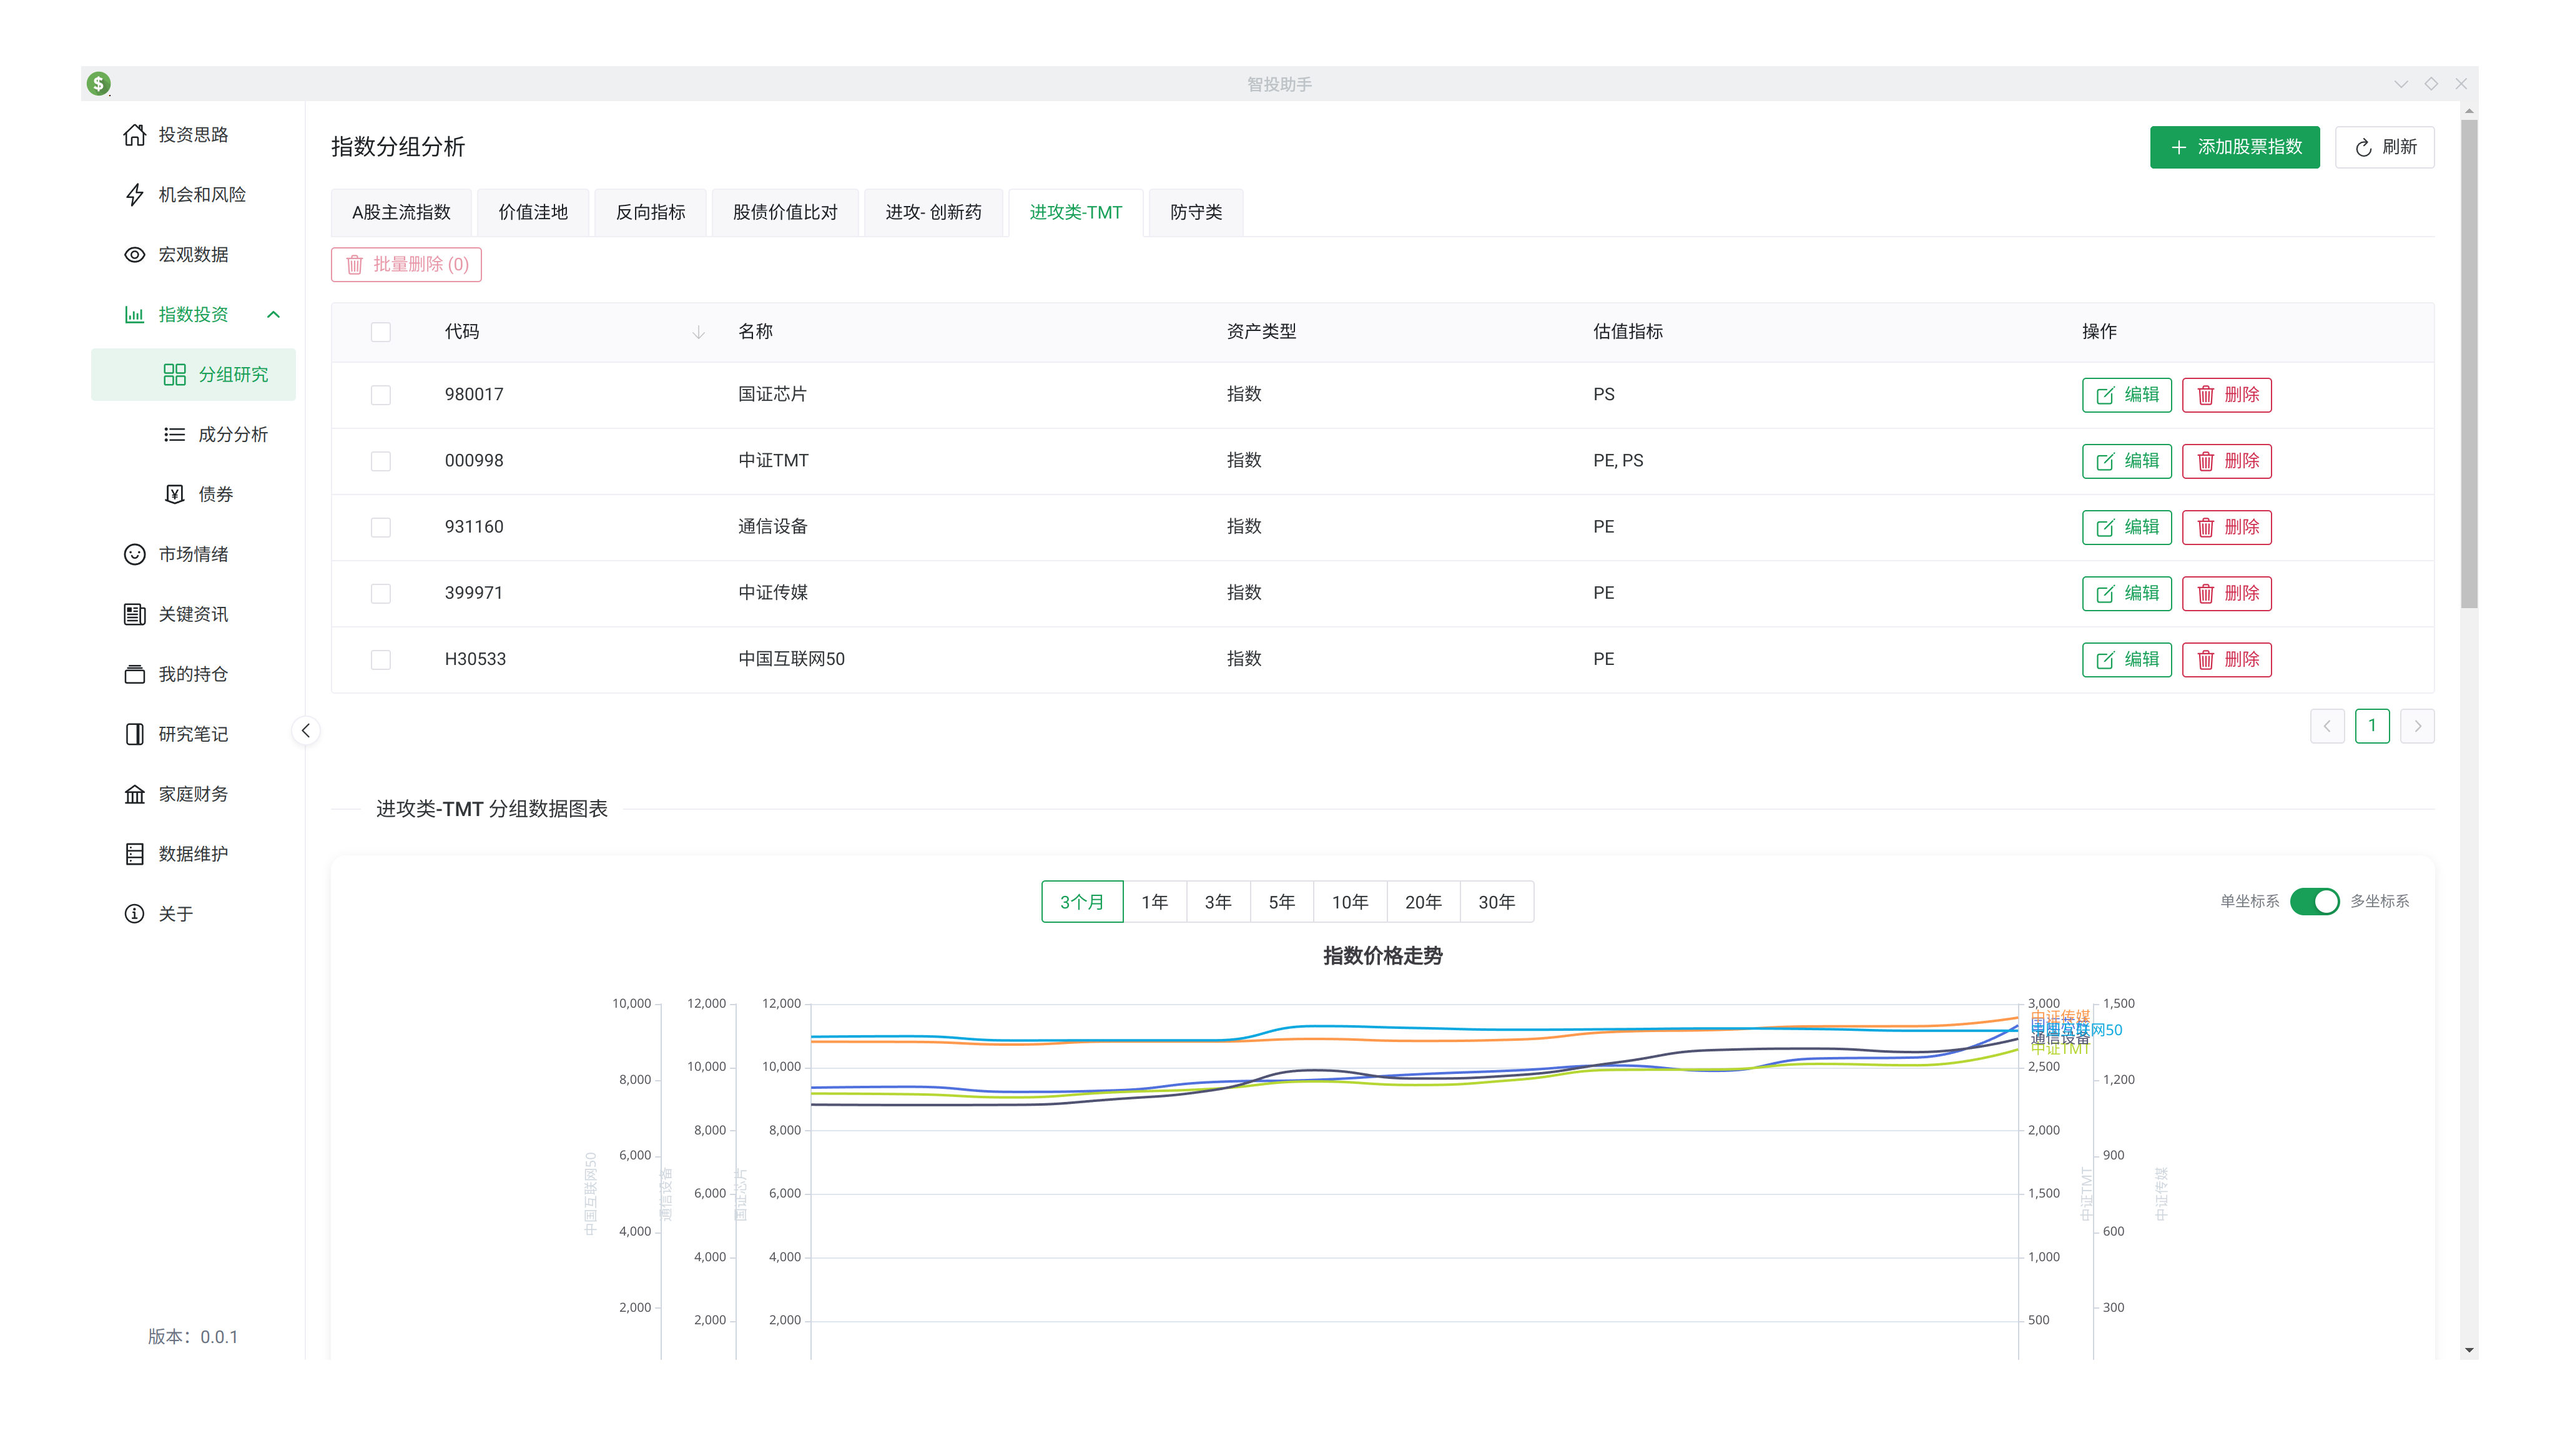
Additionally, because the price bases of different indices vary greatly (some around 1,000 points, others five or six thousand), placing them together can make smaller indices look like indistinguishable straight lines. Therefore, we provide a "Multi-Axis" feature to make their trends easily distinguishable.
The purpose of constituent analysis is to understand what happens when an index's constituent stocks change. This is very important at times. For example, buying an ETF means buying a bundle of company stocks. In the CSI 300, the dominant industries used to be banking, insurance, and manufacturing. Starting from 2025, high-tech companies from the ChiNext and STAR markets were included, making the index more dynamic. Component changes in A-share indices generally happen every 6 months.
Bonds are a crucial part of asset allocation. "Stocks, Bonds, and Commodities" are our tools for all-weather asset allocation. Stocks and funds fluctuate significantly, while bonds provide capital preservation with interest. When stocks fall, we can use bonds to "buy the dip". The bond tools here catch investment opportunities. 7-day reverse repo rate + 40 BP is the risk zone, + 50 BP is the opportunity zone. For instance, if the current 7-day reverse repo rate is 1.4%, we should consider selling when the 30-year treasury rate is below 1.8% and buying when it's above 1.9%.
Opportunities and Risks
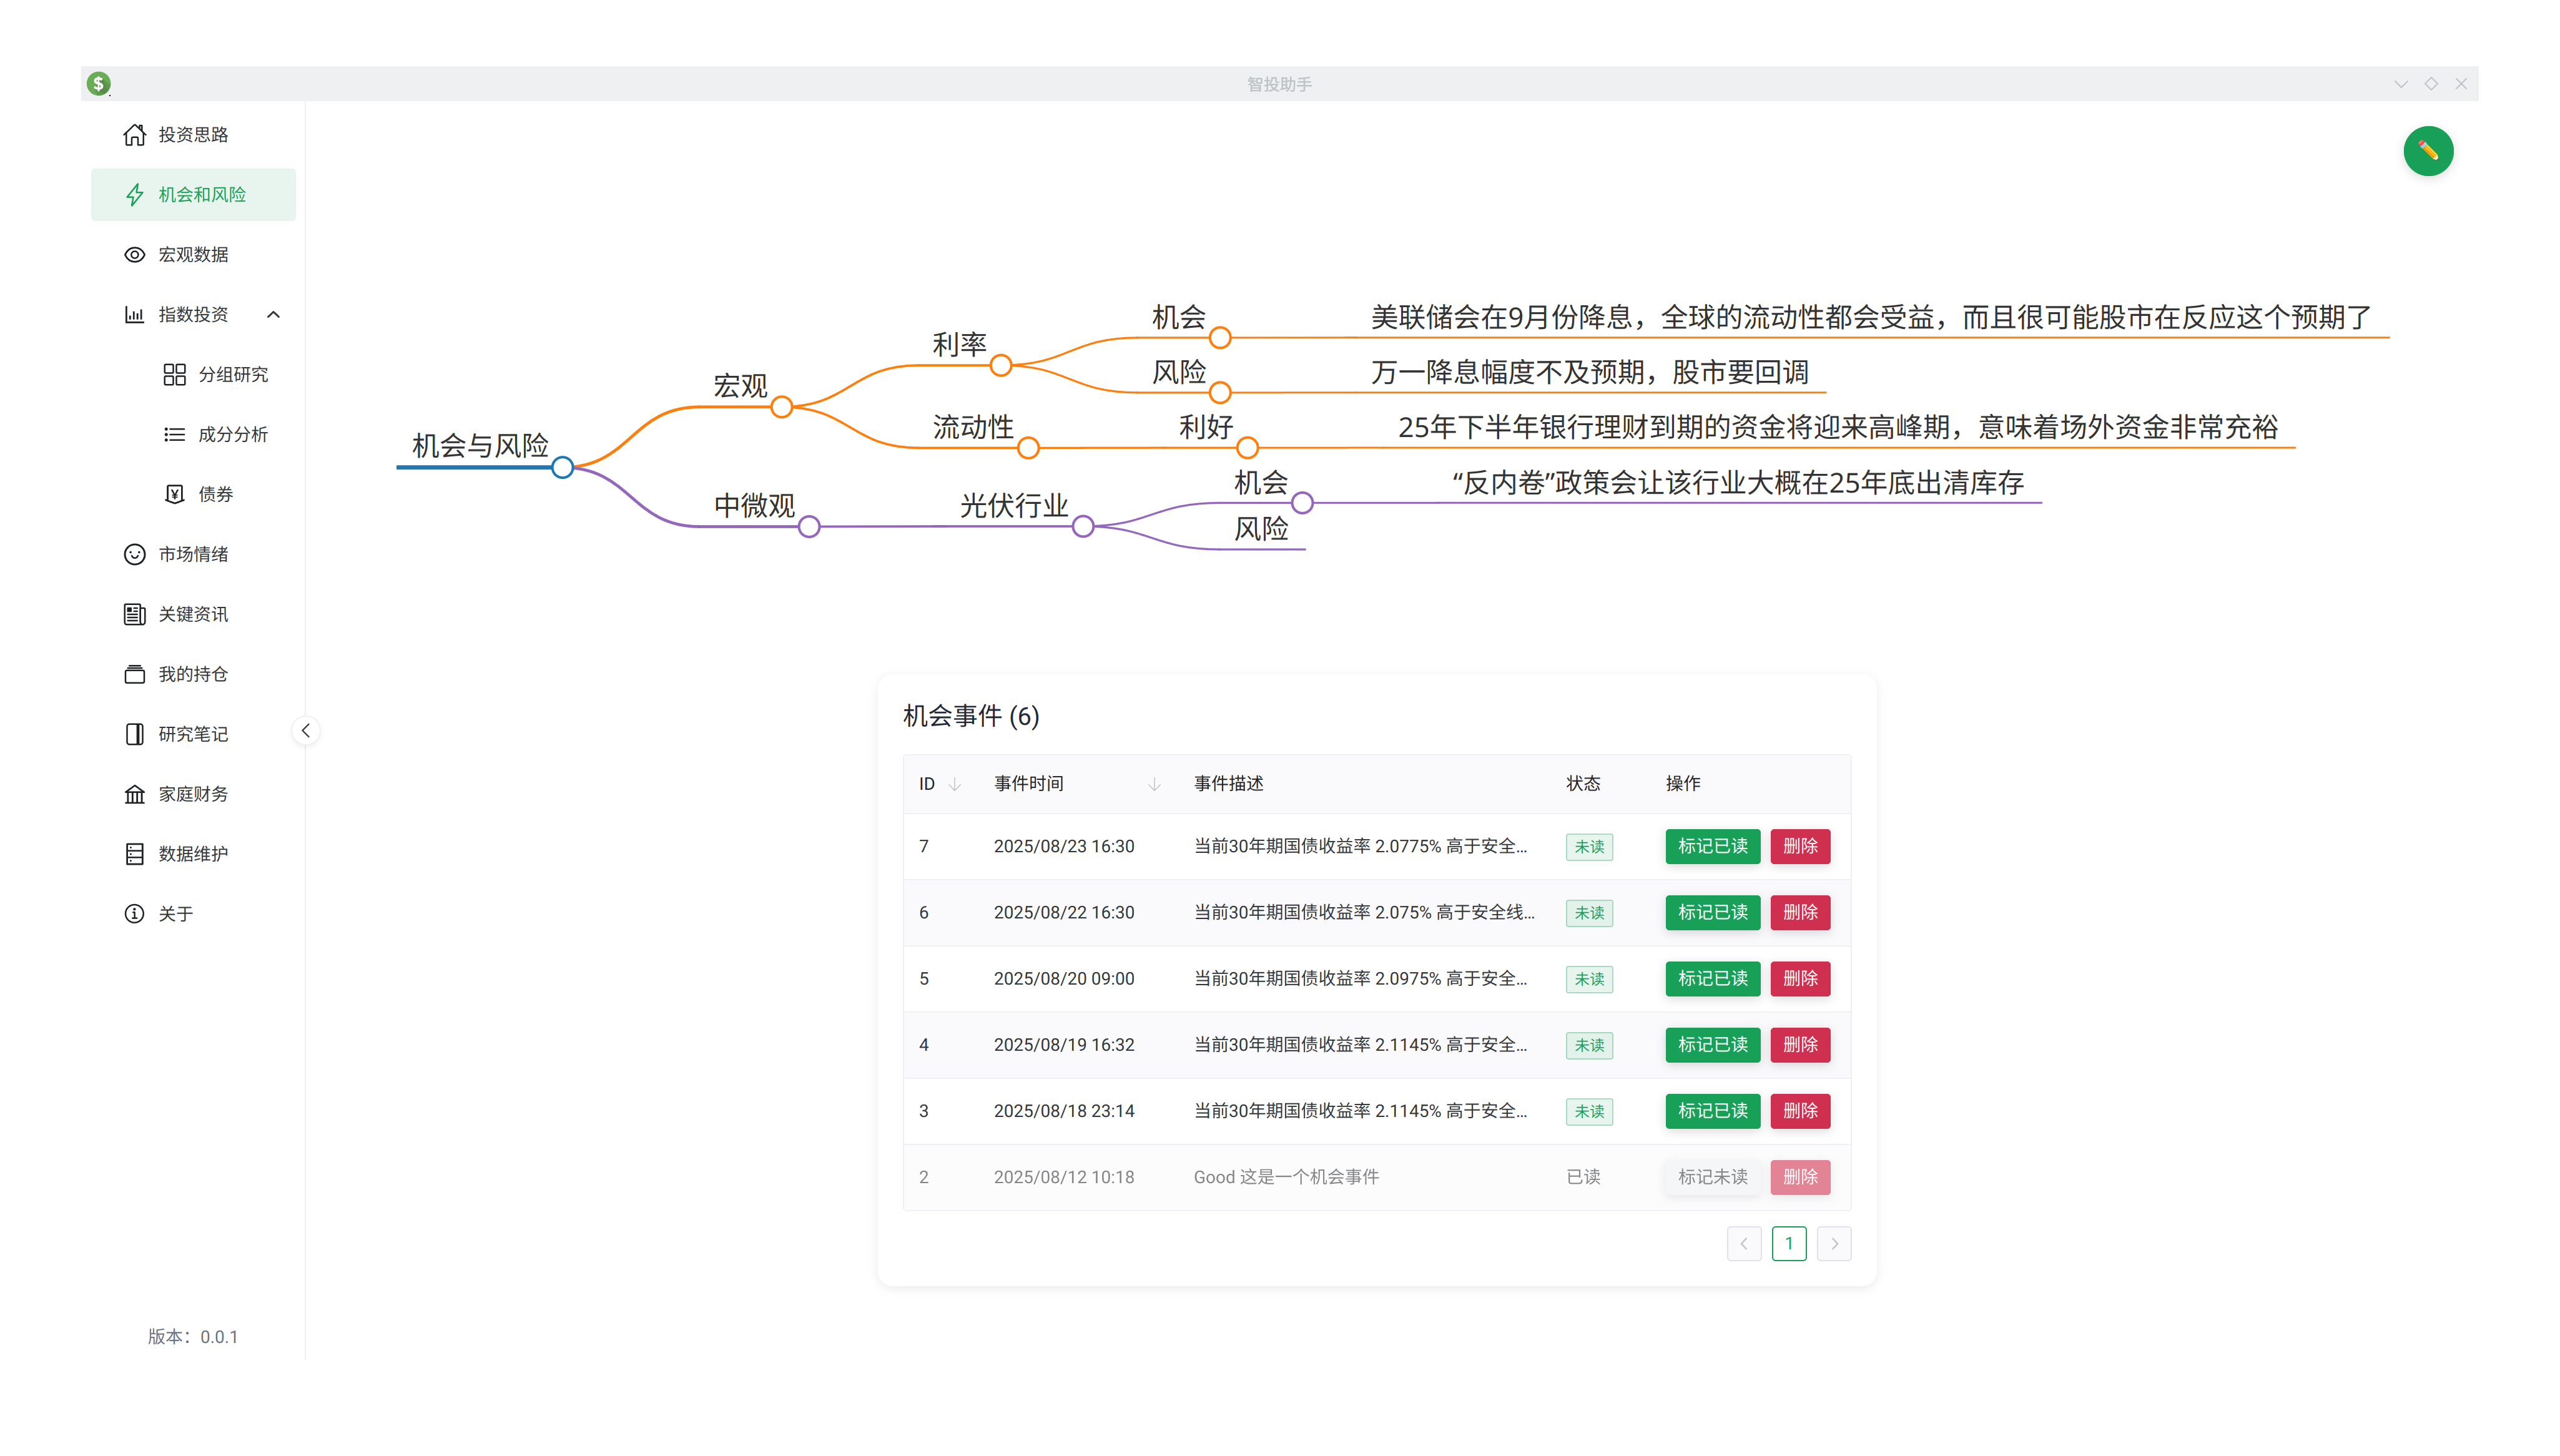
Our daily research aims to discover opportunities and risks. Currently, this module provides Mind Maps and Event Alerts.
- Mind Maps are for organizing thoughts and recording discovered opportunities and risks to execute future trading plans.
- Event Alerts notify you when the program discovers "opportunity" or "risk" events based on data and rules. Currently, it supports bond investment alerts. We are cautious about adding more alerts to avoid clutter and provide space for calm thinking.
Data Maintenance
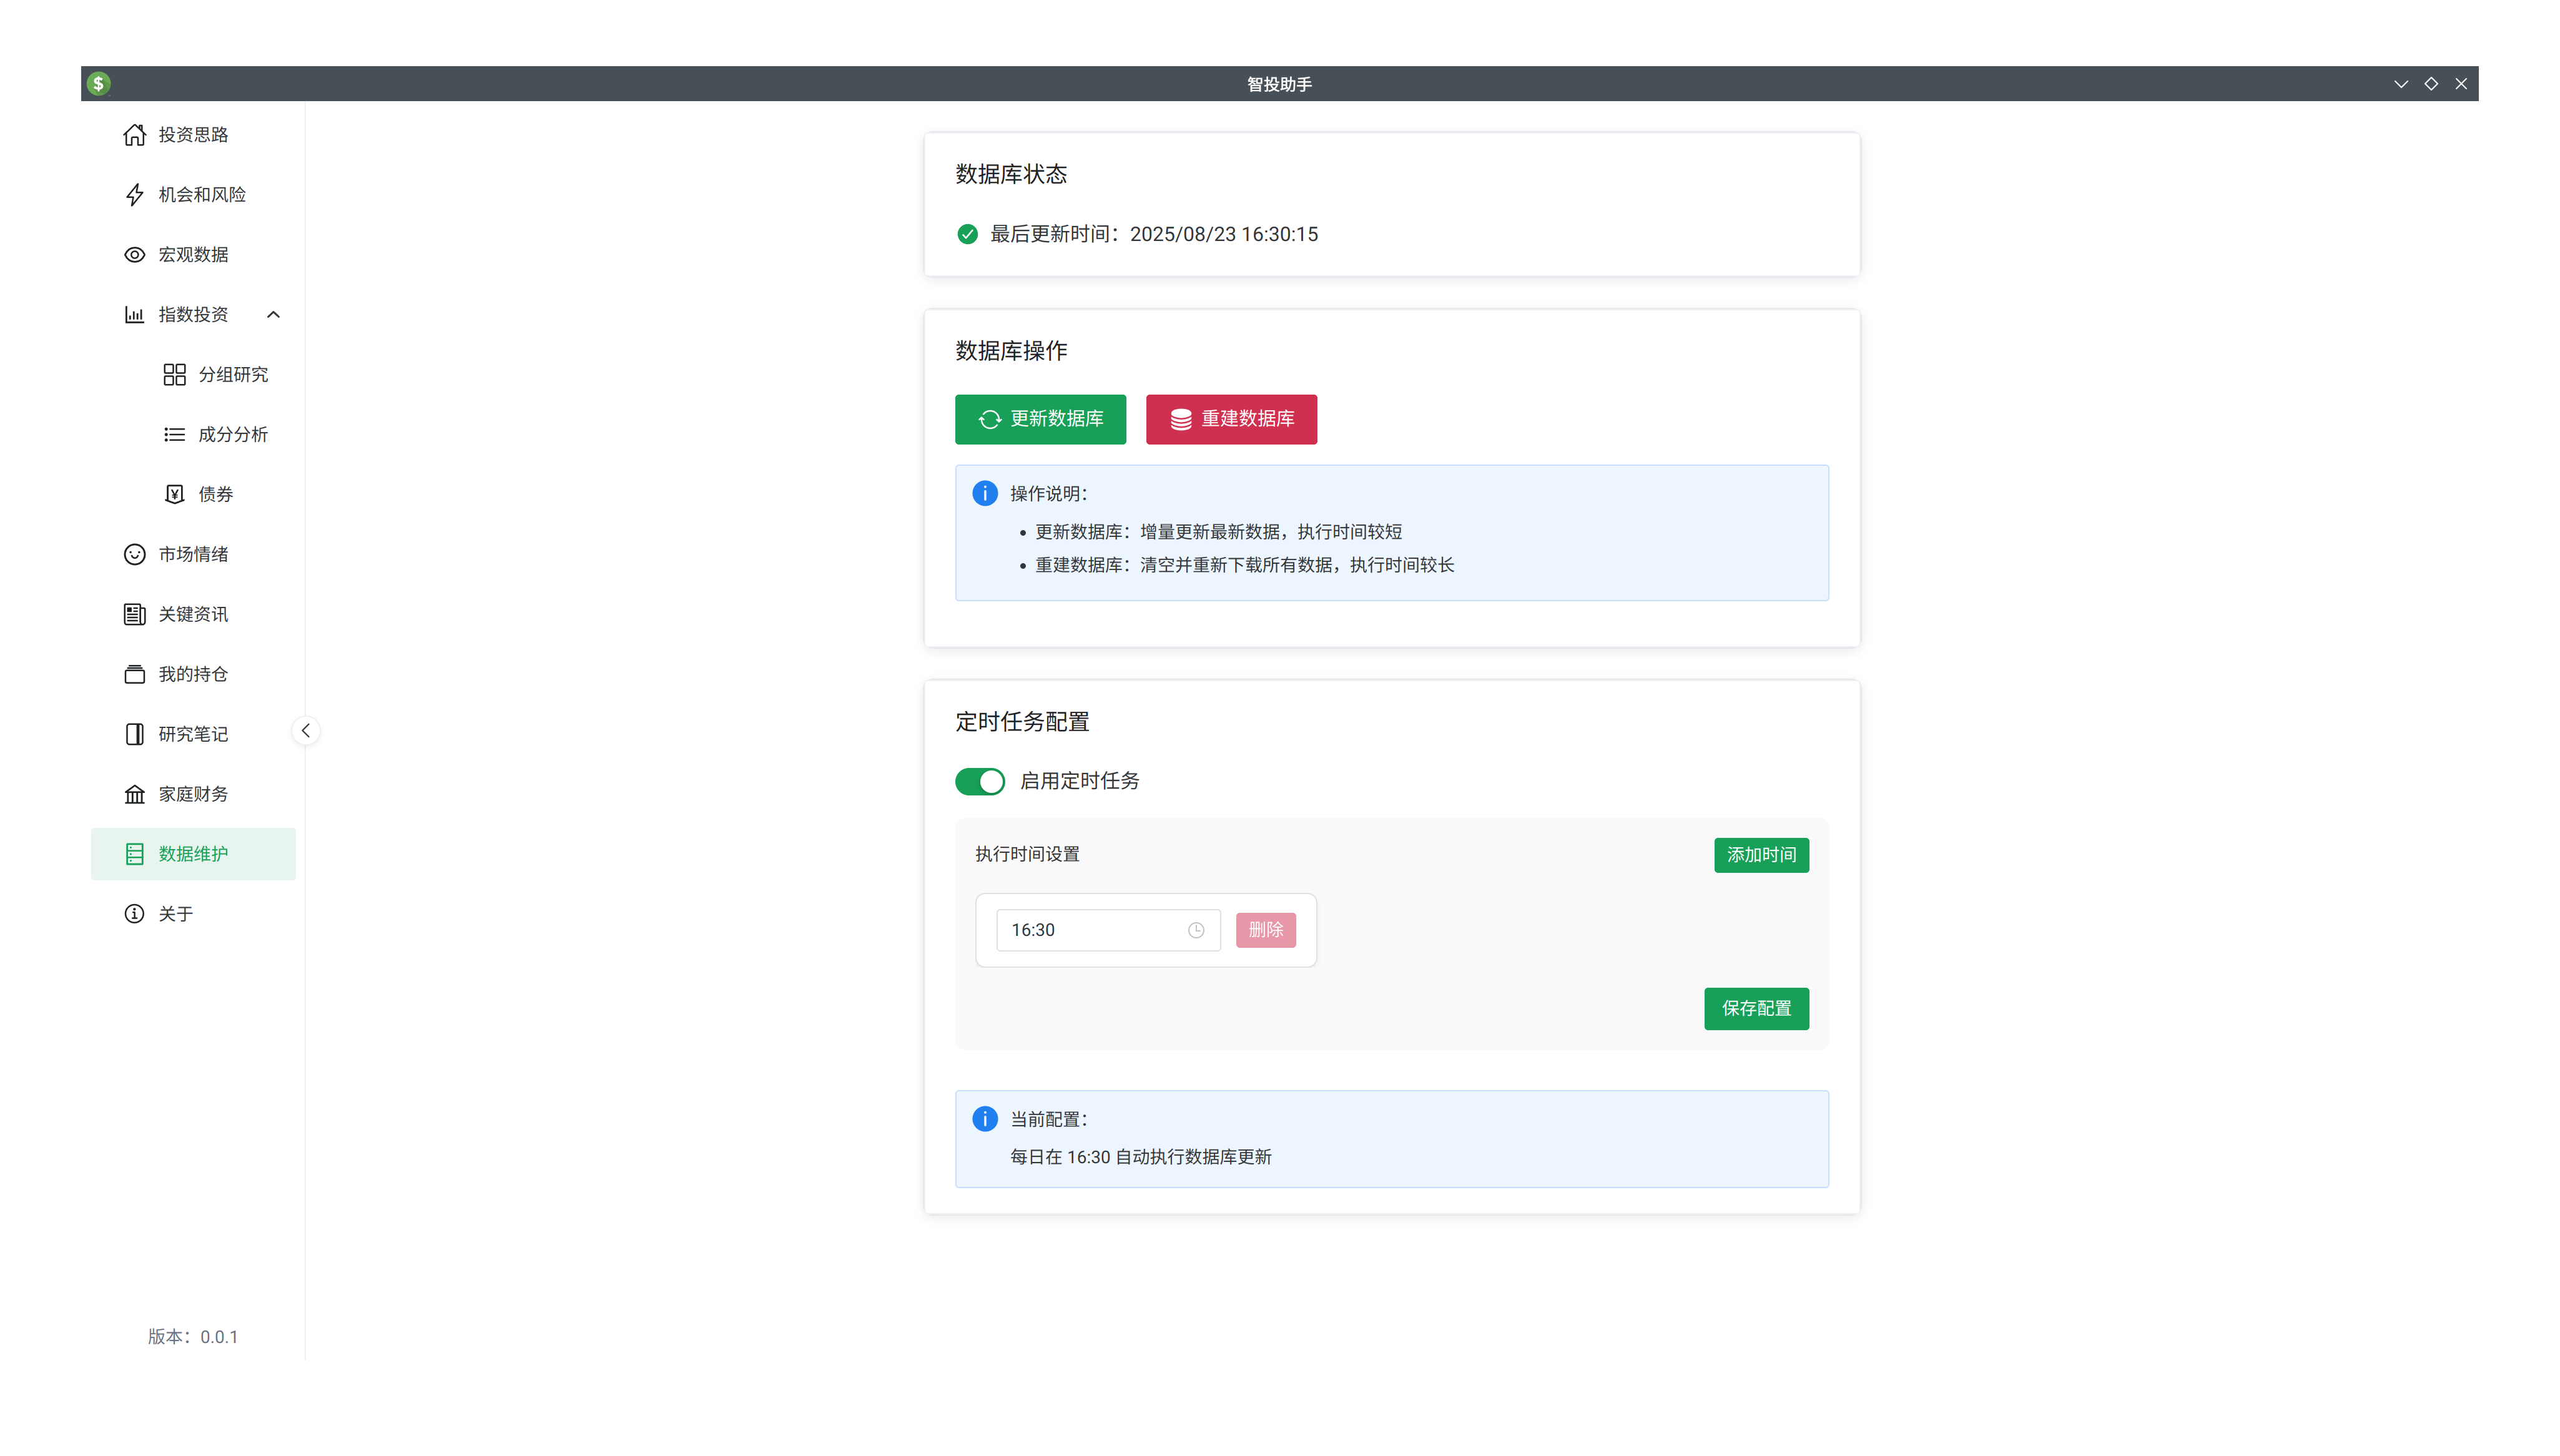
The data for this software is downloaded from public sources directly to your computer. A dedicated data maintenance interface allows you to control options like scheduled data fetching and database rebuilding.